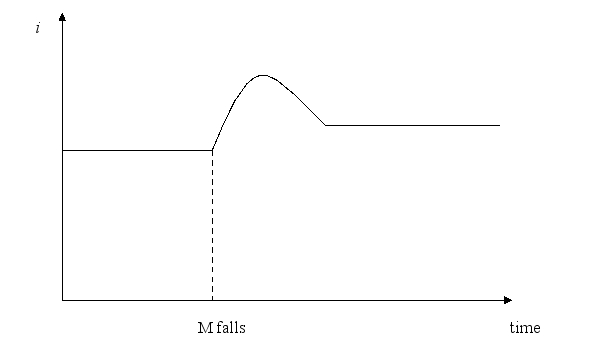
Use a graph of the interest rate against time to explain the effect of a decrease in the money supply when the liquidity effect dominates than the other effects.
Correct Answer:
Verified
View Answer
Unlock this answer now
Get Access to more Verified Answers free of charge
Q63: Using a graph of the supply and
Q64: If the economy expands, assuming there is
Q65: Using a graph of the supply and
Q66: During a recession, what happens to the
Q67: The government raises taxes to pay off
Q69: When would an increase in the money
Q70: If the economy goes into a recession,
Q71: Use a graph of the interest rate
Q72: When inflation expectations rise, what happens to
Q73: If inflation falls, show the impact on
Unlock this Answer For Free Now!
View this answer and more for free by performing one of the following actions

Scan the QR code to install the App and get 2 free unlocks

Unlock quizzes for free by uploading documents