Figure 23.1 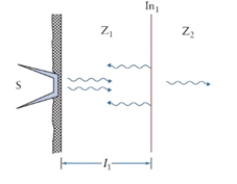 The figure shows ultrasound measurement. Interface In1 is l1 below the skin. The interface separates two media with acoustic impedances of Z1 and Z2.
-In Fig. 23.1, l1 = 2.5 cm. What is the intensity loss of a signal before interface In1? The sound attenuation coefficient is áfat = 1.0 dB cm-1 MHz-1.
Correct Answer:
Verified
RAT...
View Answer
Unlock this answer now
Get Access to more Verified Answers free of charge
Q30: In Fig. 23.1, if the echo arrives
Q31: In ultrasound imaging, when we use lower
Q32: In ultrasound imaging, when we use higher
Q33: The sine of the angle of a
Q34: Explain conceptually the difference between the following
Q35: Dolphins use ultrasound to locate obstacles and
Q36: The sine of the angle of a
Q37: When a receiver is chasing a source
Q38: The sound attenuation coefficient depends on the
Q39: For an ultrasound wave with an incident
Unlock this Answer For Free Now!
View this answer and more for free by performing one of the following actions

Scan the QR code to install the App and get 2 free unlocks

Unlock quizzes for free by uploading documents