Figure 12.1 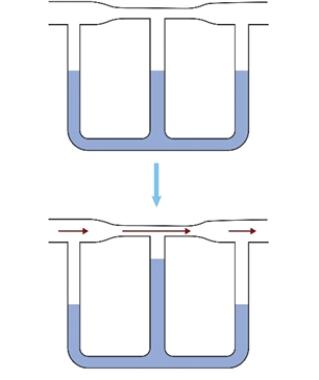 The figure shows a Venturi meter: connected tubes filled with an ideal fluid. The upper figure shows the fluid at rest, with the fluid shown by shading at the same height in a W-pipe. The lower figure shows moving fluid and uneven heights in a W-pipe.
-Explain why the fluid, as shown by shading in Fig. 12.1, rises in the middle branch of the W-pipe when the fluid above it flows in the direction shown by the arrow. Which law explains this phenomenon?
Correct Answer:
Verified
View Answer
Unlock this answer now
Get Access to more Verified Answers free of charge
Q31: The capillaries in our circulatory system are
Q32: In a viscous fluid, the force needed
Q33: An artery that is constricted due to
Q34: Laminar flow occurs only in an ideal
Q35: When blood branches into two or more
Q37: If you hold two papers at the
Q38: Arteriosclerosis is a constriction of the aorta
Q39: When a tube does not change radius,
Q40: Bernoulli's equation states that an increase in
Q41: Figure 12.5 ![]()
Unlock this Answer For Free Now!
View this answer and more for free by performing one of the following actions

Scan the QR code to install the App and get 2 free unlocks

Unlock quizzes for free by uploading documents