Which of the following correlation coefficients most likely corresponds to the pattern of data shown in the graph below? 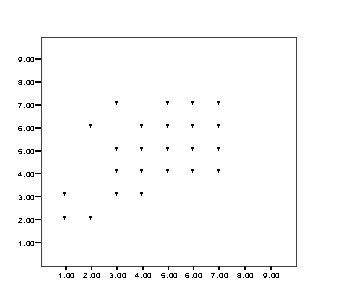
A) 1.00
B) 0.60
C) -0.60
D) 0.10
Correct Answer:
Verified
Q26: A positive correlation is observed if the
Q27: Which of the following is not true
Q28: One difficulty associated with naturalistic observation of
Q29: The correlational method provides for better understanding
Q30: Confounding is a greater problem in experimental
Q32: In a contingency table, the number in
Q33: In a study of the social interactions
Q34: An assumption underlying the Pearson r is
Q35: A researcher studying productivity among factory workers
Q36: Naturalistic observation occurs mostly in laboratory settings.
Unlock this Answer For Free Now!
View this answer and more for free by performing one of the following actions

Scan the QR code to install the App and get 2 free unlocks

Unlock quizzes for free by uploading documents