Multiple Choice
Draw a scatter plot of the data given in the table.
-The number ( ) of computers (in thousands) sold in a certain state for each year from 1994 to 1999 is given in the table below.
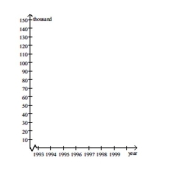
A) 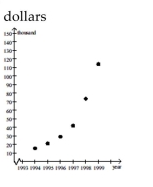
B) 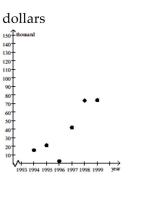
C) 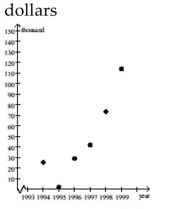
D) 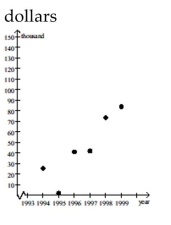
Correct Answer:
Verified
Related Questions
Unlock this Answer For Free Now!
View this answer and more for free by performing one of the following actions

Scan the QR code to install the App and get 2 free unlocks

Unlock quizzes for free by uploading documents