Figure 46-4
Use the figure to answer the corresponding question(s) . 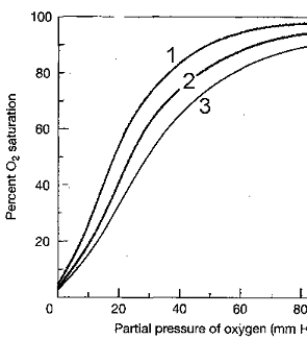 Oxygen-hemoglobin dissociation curves at three different pH levels
-The phenomenon illustrated in Figure 46-4 is known as:
A) carbon dioxide unloading.
B) the Bohr effect.
C) hemoglobin transportation.
D) chloride shift.
E) residual capacity.
Correct Answer:
Verified
Q28: During respiratory exchange, carbon dioxide moves from
Q29: Which of the following occurs during forced
Q36: Fick's law states that:
A) the amount of
Q37: Hemocyanin:
A) combines irreversibly with oxygen for transport
Q38: Dalton's Law states that:
A) the amount of
Q40: The maximum amount of air a person
Q52: The percent oxygen saturation of hemoglobin is
Q56: Figure 46-4
Use the figure to answer the
Q57: Which of the following is the most
Q60: Figure 46-3
Use the figure to answer the
Unlock this Answer For Free Now!
View this answer and more for free by performing one of the following actions

Scan the QR code to install the App and get 2 free unlocks

Unlock quizzes for free by uploading documents