The line graph shows the costs of a 30-second television spot (in thousands of dollars) during the Super Bowl from 1995 to 2005. 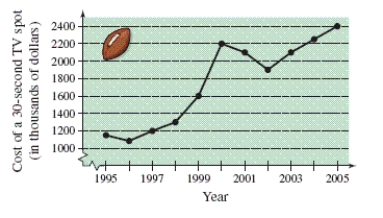 Estimate the increase in the cost of a 30-second spot from the Super Bowl in 2000 to the Super Bowl in 2005.
A) 300 thousand dollars
B) 200 thousand dollars
C) 100 thousand dollars
D) 400 thousand dollars
E) 360 thousand dollars
Correct Answer:
Verified
Q17: Place the correct symbol (<, >, or
Q18: Determine which numbers in the set are
Q19: Approximate the numbers and place the correct
Q20: List the coefficients of the variable terms
Q21: Rationalize the denominator. Then simplify your answer.
Q23: Identify the degree and leading coefficient of
Q24: Use absolute value notation to describe the
Q25: Approximate the numbers and place the correct
Q26: Evaluate the expression. Q27: List the coefficients of the variable terms![]()
Unlock this Answer For Free Now!
View this answer and more for free by performing one of the following actions

Scan the QR code to install the App and get 2 free unlocks

Unlock quizzes for free by uploading documents