Multiple Choice
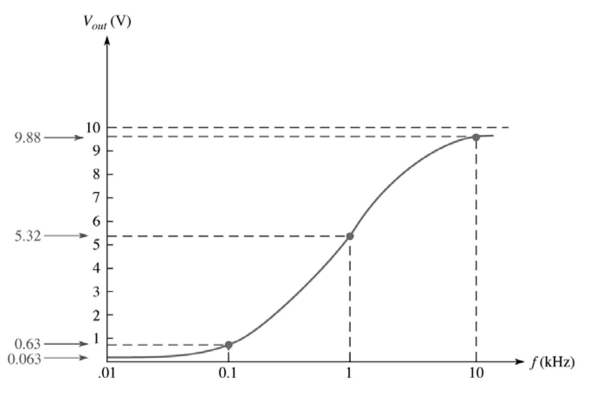
-This frequency response curve in Figure 10-4 representsW hat type of filter?
A) band pass
B) band stop
C) low pass
D) high pass
Correct Answer:
Verified
Related Questions
-This frequency response curve in Figure 10-4 representsW hat type of filter?
A) band pass
B) band stop
C) low pass
D) high pass
Correct Answer:
Verified

