Multiple Choice
Figure 36-8
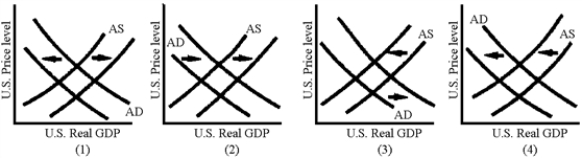
-Which of the graphs in Figure 36-8 illustrates the AD-AS shifts induced by the foreign sector following an increase in the U.S.federal deficit?
A) 1
B) 2
C) 3
D) 4
Correct Answer:
Verified
Related Questions
Q146: If the United States increased its budget
Q147: In the 1990s, the United States eliminated
Q148: In the mid-1990s, real interest rates fell
Q149: The different effects of fiscal and monetary
Q150: Suppose that the Fed decides to decrease
Q152: Figure 36-7 Q153: Why is monetary policy more effective in
![]()
Unlock this Answer For Free Now!
View this answer and more for free by performing one of the following actions

Scan the QR code to install the App and get 2 free unlocks

Unlock quizzes for free by uploading documents