Figure 36-8
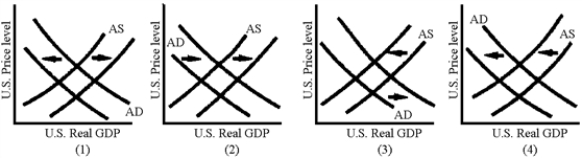
-Which of the graphs in Figure 36-8 illustrates the AD-AS shifts associated with an expansionary monetary policy?
A) 1
B) 2
C) 3
D) 4
Correct Answer:
Verified
Q155: The expected effects of fiscal contraction are
A)higher
Q156: The international trade response to a contractionary
Q157: Suppose that the Fed decides to increase
Q158: International capital flows in an open economy
Q159: Figure 36-8 Q161: Despite the monetary expansion of the 1992-2000 Q162: From 1992, America's trade performance was marked Q163: Figure 36-9 Q164: The trade deficit is the mirror image Q165: Figure 36-9 Unlock this Answer For Free Now! View this answer and more for free by performing one of the following actions Scan the QR code to install the App and get 2 free unlocks Unlock quizzes for free by uploading documents
![]()
![]()
![]()

