Figure 36-8
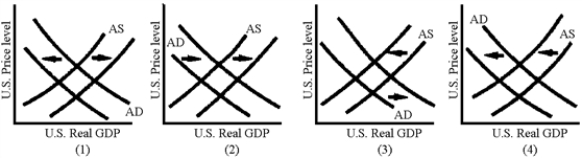
-Which of the graphs in Figure 36-8 illustrates the AD-AS shifts associated with a currency depreciation?
A) 1
B) 2
C) 3
D) 4
Correct Answer:
Verified
Q154: Figure 36-7 Q155: The expected effects of fiscal contraction are Q156: The international trade response to a contractionary Q157: Suppose that the Fed decides to increase Q158: International capital flows in an open economy Q160: Figure 36-8 Q161: Despite the monetary expansion of the 1992-2000 Q162: From 1992, America's trade performance was marked Q163: Figure 36-9 Q164: The trade deficit is the mirror image Unlock this Answer For Free Now! View this answer and more for free by performing one of the following actions Scan the QR code to install the App and get 2 free unlocks Unlock quizzes for free by uploading documents
![]()
A)higher
![]()
![]()

