Figure 36-9
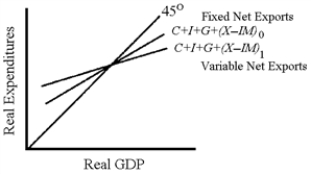
-In Figure 36-9, the C + I + G + (X − IM) 1 line is flatter than the C + I + G + (X − IM) 0 line because the
A) (X − IM) 1 line indicates that net exports decline as GDP rises.
B) (X − IM) 1 line indicates that net exports rise as GDP rises.
C) multiplier is greater for the (X − IM) 1 line.
D) (X − IM) 1 line indicates that tariffs, quotas, and other trade barriers are keeping net exports below their full potential.
Correct Answer:
Verified
Q160: Figure 36-8 Q161: Despite the monetary expansion of the 1992-2000 Q162: From 1992, America's trade performance was marked Q163: Figure 36-9 Q164: The trade deficit is the mirror image Q166: Because monetary stimulus overwhelmed fiscal contraction in Q167: The expected effect of the Bush tax Unlock this Answer For Free Now! View this answer and more for free by performing one of the following actions Scan the QR code to install the App and get 2 free unlocks Unlock quizzes for free by uploading documents
![]()
![]()

