Multiple Choice
Figure 19-1
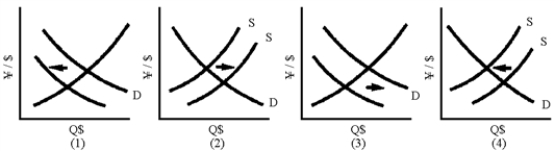
-Of the graphs in Figure 19-1, which one shows the effects of an increase in interest rates in Japan and a depreciation of the dollar?
A) 1
B) 2
C) 3
D) 4
Correct Answer:
Verified
Related Questions
Q42: If inflation in the United States is
Q104: An economic boom in the United States
Q105: Assume that the information in Table 19-1
Q106: The purchasing power parity theory is useful
Q107: The idea behind the "Big Mac index"
Unlock this Answer For Free Now!
View this answer and more for free by performing one of the following actions

Scan the QR code to install the App and get 2 free unlocks

Unlock quizzes for free by uploading documents