Figure 19-2
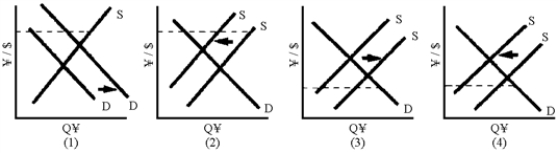
-Of the graphs in Figure 19-2, which one shows the effects on the exchange rate of an expansion in Japan?
A) 1
B) 2
C) 3
D) 4
Correct Answer:
Verified
Q175: Figure 19-2 Q176: A deficit nation in a fixed exchange Q177: One method for a deficit country to Q178: A country with an undervalued currency Q179: The appropriate "medicine" for correcting payments imbalances Q181: International trade under a floating exchange rate Q182: The principal result of the rising value Q183: For developing countries, one of the dangers Q184: The decline in the value of the Q185: After being introduced in 1999, the euro
![]()
A)will have
A)increased
Unlock this Answer For Free Now!
View this answer and more for free by performing one of the following actions

Scan the QR code to install the App and get 2 free unlocks

Unlock quizzes for free by uploading documents