Multiple Choice
Figure 19-2
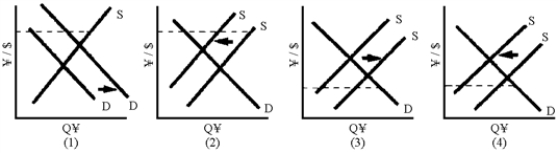
-Of the graphs in Figure 19-2, which one shows the effect of an increase in interest rates in Japan?
A) 1
B) 2
C) 3
D) 4
Correct Answer:
Verified
Related Questions
Q169: Adhering to a strict fixed exchange rate
Q170: Suppose that a nation has adopted a
Q171: In order to "defend" its overvalued currency,
Q172: Figure 19-3 Q173: To "cure" their balance of payments deficits
![]()
Unlock this Answer For Free Now!
View this answer and more for free by performing one of the following actions

Scan the QR code to install the App and get 2 free unlocks

Unlock quizzes for free by uploading documents