Figure 33-5
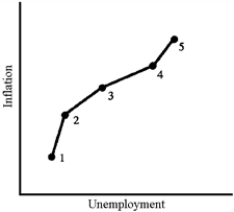
-The data illustrated in Figure 33-5 would be most representative of which of the following decades?
A) The 1960s
B) The 1970s
C) The 1980s
D) The 1990s
Correct Answer:
Verified
Q110: Which of the following is most likely
Q111: One of the reasons why the Phillips
Q112: Which of the following is most likely
Q113: In the 1990s, the United States benefited
Q114: Which of the following led to the
Q116: If unemployment and inflation always move in
Q117: If fluctuations in economic activity come from
Q118: Empirical research suggests that the steepness of
Q119: An increase in aggregate demand is most
Q120: Figure 33-6
![]()
Unlock this Answer For Free Now!
View this answer and more for free by performing one of the following actions

Scan the QR code to install the App and get 2 free unlocks

Unlock quizzes for free by uploading documents