Figure 10-1
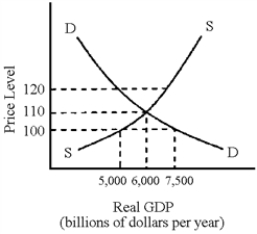
-In Figure 10-1, what is the equilibrium level of real GDP and equilibrium price?
A) $6,000 billion real GDP and price level of 110
B) $5,000 billion real GDP and price level of 120
C) $5,000 billion real GDP and price level of 110
D) $7,500 billion real GDP and price level of 100
Correct Answer:
Verified
Q106: The typical movement of the aggregate supply
Q107: At levels of output close to full
Q108: If the prices of inputs change, what
Q109: Many economists are in favor of increased
Q110: In 1986, OPEC countries increased their production
Q112: Increases in the availability of natural resources
Q113: Educational reforms that result in improved reading
Q114: Figure 10-1 Q115: The price of imported oil decreased in Q116: Figure 10-1
![]()
![]()
Unlock this Answer For Free Now!
View this answer and more for free by performing one of the following actions

Scan the QR code to install the App and get 2 free unlocks

Unlock quizzes for free by uploading documents