Multiple Choice
Figure 10-3
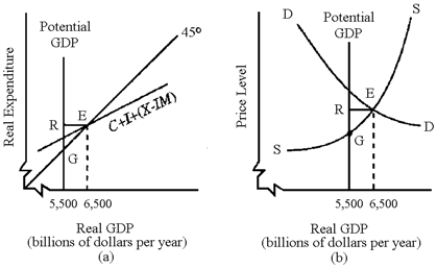
-In Figure 10-3, both graphs (a) and (b) indicate that the economy is experiencing a(n)
A) recessionary gap of RE.
B) recessionary gap of RG.
C) inflationary gap of RG.
D) inflationary gap of RE.
Correct Answer:
Verified
Related Questions
Q128: If the MPC of an economy is
Q129: Figure 10-2 Q130: How is it possible for the economy Q131: Assume an economy with an upward-sloping aggregate Q132: When inflation occurs, net exports will Q134: Figure 10-2 Q135: The federal government increases spending by $50 Unlock this Answer For Free Now! View this answer and more for free by performing one of the following actions Scan the QR code to install the App and get 2 free unlocks Unlock quizzes for free by uploading documents
![]()
A)increase as
![]()

