Figure 10-4
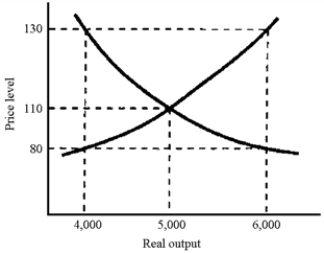
-In Figure 10-4, if full employment occurs at 5,000 and the price level is currently 130, then we can expect the
A) aggregate supply curve to shift to the left until a new equilibrium is established at an output level of 4,000.
B) aggregate demand curve to shift to the right until a new equilibrium is established at an output level of 6,000.
C) price level to fall to 110.
D) aggregate demand to shift to the left and aggregate supply to shift to the right until the price level reaches 130.
Correct Answer:
Verified
Q138: As long as the aggregate supply curve
Q139: Figure 10-2 Q140: How is it possible for the economy Q141: An inflationary gap will exist when Q142: A recession can be expected to reduce Q144: Most economists agree that the economy will Q145: An equilibrium point beyond a potential GDP
![]()
A)aggregate demand
Unlock this Answer For Free Now!
View this answer and more for free by performing one of the following actions

Scan the QR code to install the App and get 2 free unlocks

Unlock quizzes for free by uploading documents