Multiple Choice
Figure 10-7
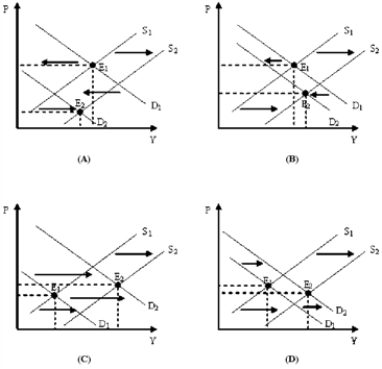
-Which of the diagrams in Figure 10-7 represents a period of economic growth and inflation?
A) (A)
B) (B)
C) (C)
D) (D)
Correct Answer:
Verified
Related Questions
Q202: As the multiplier process is working on
Q203: Figure 10-9 Q204: The fact that severe fluctuations in inflation Q205: Figure 10-7 Q206: The case for government stabilization policy is Q208: Suppose we observe an economy experience an Unlock this Answer For Free Now! View this answer and more for free by performing one of the following actions Scan the QR code to install the App and get 2 free unlocks Unlock quizzes for free by uploading documents
![]()
![]()

