Figure 10-7
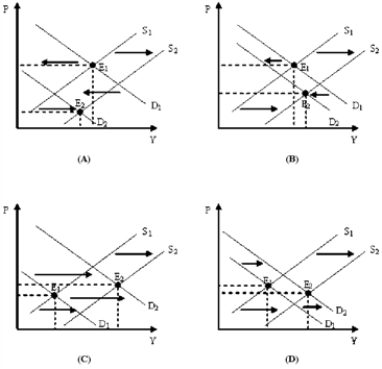
-Which of the diagrams in Figure 10-7 shows an economic expansion caused primarily by a change in aggregate demand?
A) (A)
B) (B)
C) (C)
D) (D)
Correct Answer:
Verified
Q215: Figure 10-7 Q216: Distinguish between a movement along the aggregate Q217: Figure 10-8 Q218: Why is it possible that the economy Q219: The U.S.economy in the mid-2000s did not Q221: When the price level is considered, the Q222: What would be the likely result of Q223: Discuss some of the arguments that help Q224: Why is a period of stagflation part Q225: Using the aggregate demand/aggregate supply model, explain
![]()
![]()
Unlock this Answer For Free Now!
View this answer and more for free by performing one of the following actions

Scan the QR code to install the App and get 2 free unlocks

Unlock quizzes for free by uploading documents