Multiple Choice
Figure 8-2
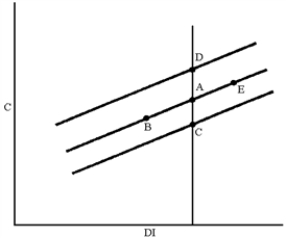
-In Figure 8-2, which of the following moves can be explained by a decrease in the price level?
A) A to B
B) A to C
C) A to D
D) A to E
Correct Answer:
Verified
Related Questions
Q105: To predict the effects of a tax
Q106: Figure 8-1 Q107: If the MPC increases in value, what Q108: Assume that consumption in the United States Q109: In 1963, government economists assumed that the Q111: In Macronesia, the MPC is approximately 0.80.If
![]()
Unlock this Answer For Free Now!
View this answer and more for free by performing one of the following actions

Scan the QR code to install the App and get 2 free unlocks

Unlock quizzes for free by uploading documents