Figure 18-1 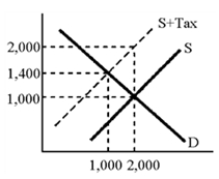
-According to the graph in Figure 18-1, the increase in the amount that consumers pay as a result of the tax is
A) 1,000.00
B) 600
C) 400
D) indeterminate.
Correct Answer:
Verified
Q164: Figure 18-2 Q165: The concept that describes the situation where Q166: Figure 18-1 Q167: Which of the following taxes is least Q168: Suppose Mishka buys 15 apples per month Q170: Figure 18-2 Q171: Some enterprising individuals produce and sell alcoholic Q172: Who actually pays an excise tax Q173: Figure 18-2 Q174: Which of the following taxes is most Unlock this Answer For Free Now! View this answer and more for free by performing one of the following actions Scan the QR code to install the App and get 2 free unlocks Unlock quizzes for free by uploading documents![]()
![]()
![]()
A)is determined![]()

