Multiple Choice
Figure 10-2
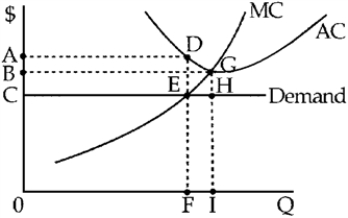
-Figure 10-2 shows demand and short-run cost curves for a perfectly competitive firm.At its profit-maximizing output, the firm's total ____ is represented by area ____.
A) loss; GBHC
B) profit; ADGHC
C) loss; ADEC
D) profit; EGH
Correct Answer:
Verified
Related Questions

