Figure 9-1
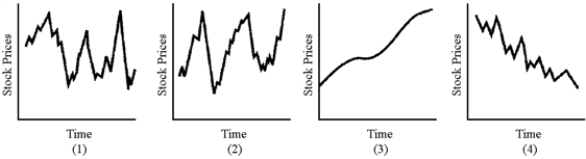
-Which of the graphs in Figure 9-1 best illustrates the path of a composite of common stock prices over the long term?
A) (1)
B) (2)
C) (3)
D) (4)
Correct Answer:
Verified
Q203: Why is diversification recommended for investors?
Q204: Explain how "herd behavior" affects the stock
Q205: From the viewpoint of the individual investor,
Q206: As an investor, would you agree to
Q207: Corporate income is taxed twice-once in the
Q209: An investor is trying to decide whether
Q210: Explain why using leverage to purchase risky
Q211: For some investors, derivatives can be attractive
Q212: Assume Jean-Claude purchased real estate for $500,000
Q213: Explain how mutual funds are advantageous to
Unlock this Answer For Free Now!
View this answer and more for free by performing one of the following actions

Scan the QR code to install the App and get 2 free unlocks

Unlock quizzes for free by uploading documents