The RC and More Superstore decides to track customer complaints as part of their ongoing customer satisfaction improvement program. After collecting data for two months, their check sheet appears as follows: 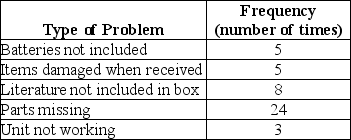 If they construct a Pareto chart, what is the cumulative percentage of the two left most bars?
A) 12%
B) 27%
C) 40%
D) 60%
E) 71%
Correct Answer:
Verified
Q26: _ are frequency charts that are aided
Q28: The RC and More Superstore decides to
Q30: _ are simply graphical representations of data
Q31: The RC and More Superstore decides to
Q32: The cause-and-effect diagram is also called a(n)
Q33: The RC and More Superstore decides to
Q35: The _ is used to move to
Q36: Calculate the number of classes if there
Q37: Calculate the number of classes if there
Q38: The first step in creating a _
Unlock this Answer For Free Now!
View this answer and more for free by performing one of the following actions

Scan the QR code to install the App and get 2 free unlocks

Unlock quizzes for free by uploading documents