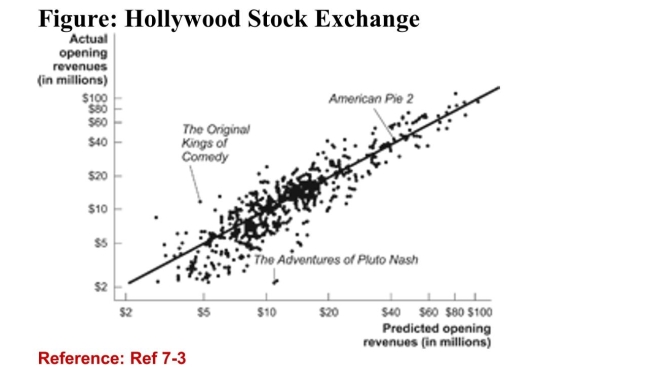
 (Figure: Hollywood Stock Exchange) The data points in thefigure represent the opening revenue for movies plotted againsttheir predicted opening revenues according to the HollywoodStock Exchange (HSX) . Most of them fall along the 45-degreeline. What does this suggest?
A) The HSX does not do a good job predicting movie revenue.
B) On average, most movies do worse than their HSX predictions.
C) On average, the HSX accurately predicts movie revenues.
D) On average, most movies do better than their HSX predictions.
Correct Answer:
Verified
Q80: How can a futures contract mitigate exchange
Q81: If you worked for a Hollywood prediction
Q87: The advantages of prediction markets include:
A)the ability
Q107: A rising price for gasoline may mean
Q110: The best known prediction market is the:
A)
Q120: Based on economist Richard Roll's work, the
Q180: The major factor determining the price of
Q191: One advantage of prediction markets is that
Q216: Prices are incentives for sellers.
Q218: Prices are the heart of the:
A) political
Unlock this Answer For Free Now!
View this answer and more for free by performing one of the following actions

Scan the QR code to install the App and get 2 free unlocks

Unlock quizzes for free by uploading documents