(Figure: Demand Shift) In the figure, the demand curve shiftedfrom D0 to D1. To describe this movement, we would say that: 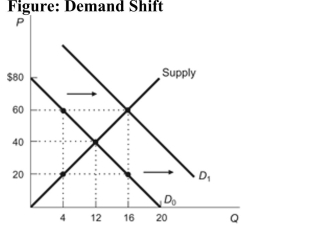
A) demand increased, which caused an increase in supply.
B) quantity demanded increased, which caused an increase in supply.
C) demand increased, which caused an increase in quantity supplied.
D) quantity demanded increased, which caused an increase in quantity supplied.
Correct Answer:
Verified
Q48: Figure: Demand, Supply Shifts Q49: Q51: An early frost in the vineyards of Q52: Which of the following would NOT lead Q80: Which of the following would cause the Q82: Use the following to answer questions: Q107: Which of the following might explain why Q113: Which of the following would increase the Q120: Suppose there is an increase in demand Q141: When you move along a demand curve:![]()
![]()
Figure: Market
A)
Unlock this Answer For Free Now!
View this answer and more for free by performing one of the following actions

Scan the QR code to install the App and get 2 free unlocks

Unlock quizzes for free by uploading documents