Multiple Choice
Figure: The Home Monopolist's Market 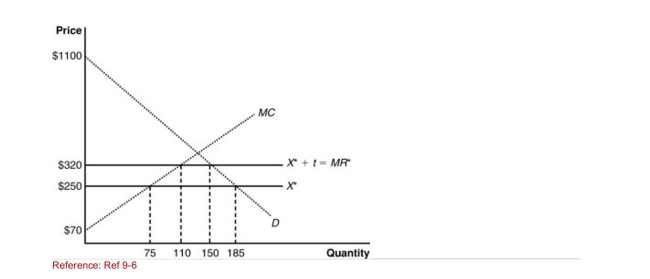 (Figure: The Home Monopolist's Market) The graph shows a home
Monopolist market with the imposition of a tariff.After the imposition
Of the tariff, the home monopolist saw an increase in production of
______ and the producer surplus increased by ________.
A) 55 units; $5,250
B) 75 units; $1,225
C) 100 units; $6,475
D) 35 units; $6,475
Correct Answer:
Verified
Related Questions
Q42: Figure: Supply and Demand at Home
Q43: How does the demand curve facing a
Q44: When a country imposes a tariff to
Q46: For a home monopolist, a quota allows

