Essay
The following graph shows the relationship between a large country
importer of a good, say steel, and its tariff rate (in percentages).Explain
why the curve reaches maximum and then declines. 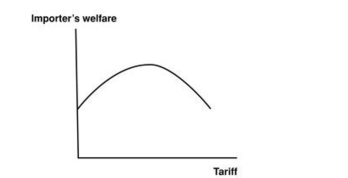
Correct Answer:
Verified
The curve rises whenever the termsoftr...
View Answer
Unlock this answer now
Get Access to more Verified Answers free of charge
Related Questions
Q79: If S = 1P represents a country's
Q80: In general, a tariff reduces the national
Q85: To measure the impact of a tariff
Unlock this Answer For Free Now!
View this answer and more for free by performing one of the following actions

Scan the QR code to install the App and get 2 free unlocks

Unlock quizzes for free by uploading documents