Figure: Home's Exporting Industry I
The graph shows information about a home exporter. 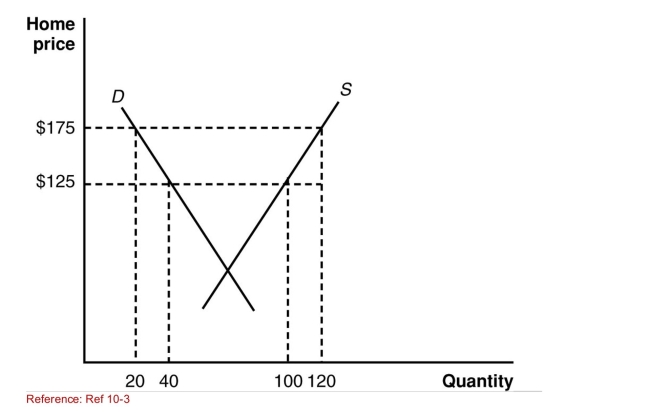
(Figure: Home's Exporting Industry I) According to the
Graph, an export subsidy of $50 results in a(n) ________ in
Producer surplus by the amount of ______.
A) reduction; $6,500
B) reduction; $5,000
C) increase; $5,500
D) increase; $4,000
Correct Answer:
Verified
Q19: What do developing nations expect from wealthy
Q20: In Europe, the Common Agricultural Policy is
Q21: When assessing the welfare effect of an
Q22: Figure: Home's Exporting Industry I
The graph shows
Q23: Suppose that the world price of sugar
Q25: Figure: Home's Exporting Industry I
The graph shows
Q26: Figure: Home's Exporting Industry I
The graph shows
Q27: Suppose that the world price of sugar
Q28: SCENARIO: SUGAR TRADE IN BIRDONIA
In autarky, suppose
Q29: SCENARIO: DEMAND AND SUPPLY FOR IRON ORE
The
Unlock this Answer For Free Now!
View this answer and more for free by performing one of the following actions

Scan the QR code to install the App and get 2 free unlocks

Unlock quizzes for free by uploading documents