The plots shown here are normal probability plots for random samples of 65 healthy male and 65 healthy female body temperatures. 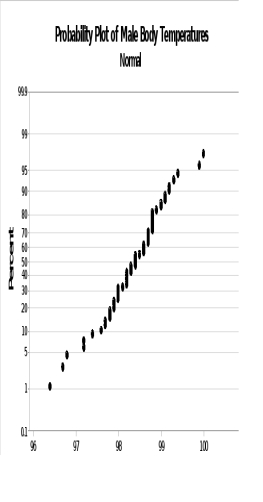
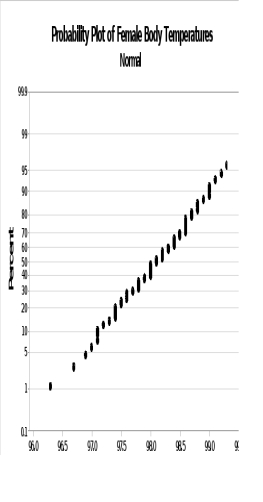 Which group is more likely to be normally distributed?
A) The males are more likely to be normal because their plot does not appear to be a straight line.
B) The females are more likely to be normal because their plot does not appear to be a straight line.
C) The females are more likely to be normal because their plot does appear to be a straight line.
D) The two groups appear to be equally normally distributed.
Correct Answer:
Verified
Q13: A study of college dropouts models the
Q14: The memoryless property of the exponential distribution
Q15: Let X = the time (in minutes)
Q16: If a random variable X is normally
Q17: Seismologists have discovered a thermal disturbance in
Q19: A density curve is a:
A) mathematical device
Q20: Although the binomial distribution is discrete, in
Q21: Variable N N* Mean SE Mean StDev
Q22: Metro buses are scheduled to arrive at
Q23: Spinal fusion surgery has become a popular
Unlock this Answer For Free Now!
View this answer and more for free by performing one of the following actions

Scan the QR code to install the App and get 2 free unlocks

Unlock quizzes for free by uploading documents