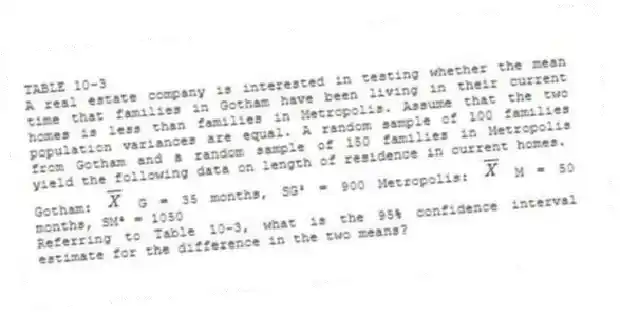
TABLE 10-3
A real estate company is interested in testing whether the mean time that families in Gotham have been living in their current homes is less than families in Metropolis. Assume that the two population variances are equal. A random sample of 100 families from Gotham and a random sample of 150 families in Metropolis yield the following data on length of residence in current homes.
Gotham:  G = 35 months, SG² = 900 Metropolis:
  M = 50 months, SM² = 1050
-Referring to Table 10-3, what is the 95% confidence interval estimate for the difference in the two means?
Correct Answer:
Verified
View Answer
Unlock this answer now
Get Access to more Verified Answers free of charge
Q25: TABLE 10-3
A real estate company is interested
Q26: TABLE 10-3
A real estate company is interested
Q27: TABLE 10-3
A real estate company is interested
Q28: TABLE 10-4
Two samples each of size 25
Q29: TABLE 10-2
A researcher randomly sampled 30 graduates
Q31: TABLE 10-4
Two samples each of size 25
Q32: TABLE 10-2
A researcher randomly sampled 30 graduates
Q33: TABLE 10-3
A real estate company is interested
Q34: TABLE 10-2
A researcher randomly sampled 30 graduates
Q35: TABLE 10-2
A researcher randomly sampled 30 graduates
Unlock this Answer For Free Now!
View this answer and more for free by performing one of the following actions

Scan the QR code to install the App and get 2 free unlocks

Unlock quizzes for free by uploading documents