TABLE 10-8
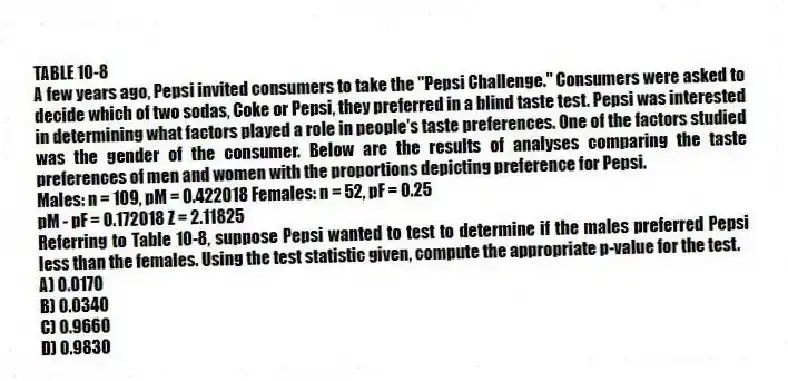
A few years ago, Pepsi invited consumers to take the "Pepsi Challenge." Consumers were asked to decide which of two sodas, Coke or Pepsi, they preferred in a blind taste test. Pepsi was interested in determining what factors played a role in people's taste preferences. One of the factors studied was the gender of the consumer. Below are the results of analyses comparing the taste preferences of men and women with the proportions depicting preference for Pepsi.
Males: n = 109, pM = 0.422018 Females: n = 52, pF = 0.25
pM - pF = 0.172018 Z = 2.11825
-Referring to Table 10-8, suppose Pepsi wanted to test to determine if the males preferred Pepsi less than the females. Using the test statistic given, compute the appropriate p-value for the test.
A) 0.0170
B) 0.0340
C) 0.9660
D) 0.9830
Correct Answer:
Verified
Q106: If we wish to determine whether there
Q107: In testing the difference between two proportions
Q108: A powerful women's group has claimed that
Q108: A powerful women's group has claimed that
Q109: TABLE 10-8
A few years ago, Pepsi invited
Q111: A powerful women's group has claimed that
Q112: If you wish to determine whether there
Q113: TABLE 10-8
A few years ago, Pepsi invited
Q115: TABLE 10-8
A few years ago, Pepsi invited
Q116: The Wall Street Journal recently ran an
Unlock this Answer For Free Now!
View this answer and more for free by performing one of the following actions

Scan the QR code to install the App and get 2 free unlocks

Unlock quizzes for free by uploading documents