TABLE 10-13
The amount of time required to reach a customer service representative has a huge impact on customer satisfaction. Below is the Microsoft Excel output from a study to see whether there is evidence of a difference in the mean amounts of time required to reach a customer service representative between two hotels. Assume that the population variances in the amount of time for the two hotels are not equal.
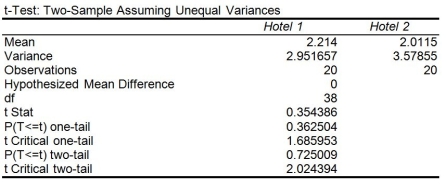
-Referring to Table 10-13, which of the following represents the relevant hypotheses to test whether there is evidence of a difference in the mean amounts of time required to reach a customer service representative between two hotels?
A) H₀: π₁ - π₂ ≥ 0 versus H₁: π₁ - π₂ < 0
B) H₀: π₁ - π₂ ≤ 0 versus H₁: π₁ - π₂ > 0
C) H₀: π₁ - π₂ = 0 versus H₁: π₁ - π₂ ≠ 0
D) H₀: π₁ - π₂ ≠ 0 versus H₁: πI - π₂ = 0
Correct Answer:
Verified
Q163: The F distribution is symmetric.
Q168: TABLE 10-13
The amount of time required to
Q182: TABLE 10-14
The use of preservatives by food
Q184: TABLE 10-14
The use of preservatives by food
Q190: TABLE 10-13
The amount of time required to
Q191: TABLE 10-13
The amount of time required to
Q196: TABLE 10-15
The table below presents the summary
Q199: TABLE 10-13
The amount of time required to
Q200: TABLE 10-15
The table below presents the summary
Q202: TABLE 10-15
The table below presents the summary
Unlock this Answer For Free Now!
View this answer and more for free by performing one of the following actions

Scan the QR code to install the App and get 2 free unlocks

Unlock quizzes for free by uploading documents