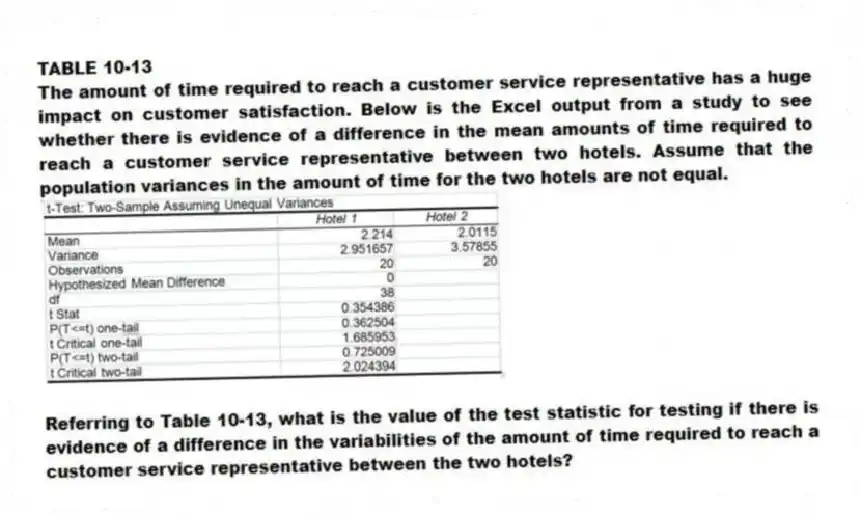
TABLE 10-13
The amount of time required to reach a customer service representative has a huge impact on customer satisfaction. Below is the Excel output from a study to see whether there is evidence of a difference in the mean amounts of time required to reach a customer service representative between two hotels. Assume that the population variances in the amount of time for the two hotels are not equal.
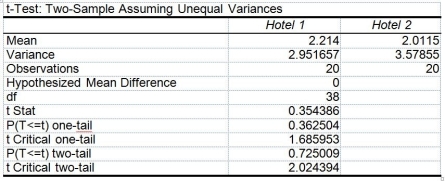
-Referring to Table 10-13, what is the value of the test statistic for testing if there is evidence of a difference in the variabilities of the amount of time required to reach a customer service representative between the two hotels?
Correct Answer:
Verified
Q163: The F distribution is symmetric.
Q165: TABLE 10-13
The amount of time required to
Q167: TABLE 10-13
The amount of time required to
Q169: TABLE 10-13
The amount of time required to
Q170: TABLE 10-13
The amount of time required to
Q170: The test for the equality of two
Q171: TABLE 10-13
The amount of time required to
Q173: TABLE 10-13
The amount of time required to
Q174: F tests are one-tail tests.
Q178: The statistical distribution used for testing the
Unlock this Answer For Free Now!
View this answer and more for free by performing one of the following actions

Scan the QR code to install the App and get 2 free unlocks

Unlock quizzes for free by uploading documents