TABLE 10-13
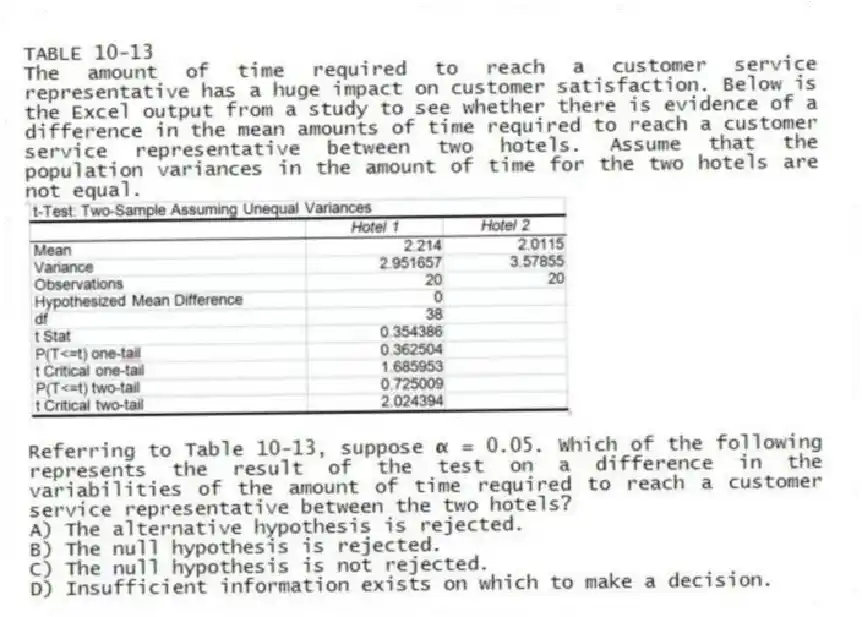
The amount of time required to reach a customer service representative has a huge impact on customer satisfaction. Below is the Excel output from a study to see whether there is evidence of a difference in the mean amounts of time required to reach a customer service representative between two hotels. Assume that the population variances in the amount of time for the two hotels are not equal.
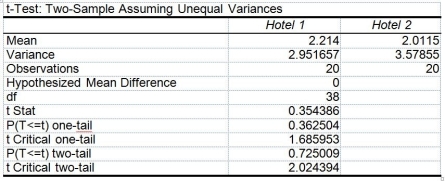
-Referring to Table 10-13, suppose α = 0.05. Which of the following represents the result of the test on a difference in the variabilities of the amount of time required to reach a customer service representative between the two hotels?
A) The alternative hypothesis is rejected.
B) The null hypothesis is rejected.
C) The null hypothesis is not rejected.
D) Insufficient information exists on which to make a decision.
Correct Answer:
Verified
Q185: TABLE 10-15
The table below presents the summary
Q186: TABLE 10-15
The table below presents the summary
Q187: TABLE 10-14
The use of preservatives by food
Q188: TABLE 10-13
The amount of time required to
Q189: TABLE 10-13
The amount of time required to
Q191: TABLE 10-13
The amount of time required to
Q192: TABLE 10-15
The table below presents the summary
Q193: TABLE 10-14
The use of preservatives by food
Q194: TABLE 10-14
The use of preservatives by food
Q195: TABLE 10-15
The table below presents the summary
Unlock this Answer For Free Now!
View this answer and more for free by performing one of the following actions

Scan the QR code to install the App and get 2 free unlocks

Unlock quizzes for free by uploading documents