TABLE 10-17
A realtor wants to compare the mean sales-to-appraisal ratios of residential properties sold in four neighborhoods (A, B, C, and D) . Four properties are randomly selected from each neighborhood and the ratios recorded for each, as shown below.
A: 1.2, 1.1, 0.9, 0.4 C: 1.0, 1.5, 1.1, 1.3
B: 2.5, 2.1, 1.9, 1.6 D: 0.8, 1.3, 1.1, 0.7
Interpret the results of the analysis summarized in the following table:
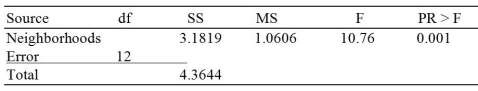
-Referring to Table 10-17, the within group sum of squares is ________.
A) 1.0606
B) 1.1825
C) 3.1819
D) 4.3644
Correct Answer:
Verified
Q13: In a one-factor ANOVA analysis,the among sum
Q16: When the F test is used for
Q221: TABLE 10-18
As part of an evaluation program,
Q222: TABLE 10-17
A realtor wants to compare the
Q223: TABLE 10-17
A realtor wants to compare the
Q225: TABLE 10-17
A realtor wants to compare the
Q226: TABLE 10-18
As part of an evaluation program,
Q227: TABLE 10-17
A realtor wants to compare the
Q228: TABLE 10-18
As part of an evaluation program,
Q229: TABLE 10-18
As part of an evaluation program,
Unlock this Answer For Free Now!
View this answer and more for free by performing one of the following actions

Scan the QR code to install the App and get 2 free unlocks

Unlock quizzes for free by uploading documents