TABLE 10-17
A realtor wants to compare the mean sales-to-appraisal ratios of residential properties sold in four neighborhoods (A, B, C, and D) . Four properties are randomly selected from each neighborhood and the ratios recorded for each, as shown below.
A: 1.2, 1.1, 0.9, 0.4 C: 1.0, 1.5, 1.1, 1.3
B: 2.5, 2.1, 1.9, 1.6 D: 0.8, 1.3, 1.1, 0.7
Interpret the results of the analysis summarized in the following table:
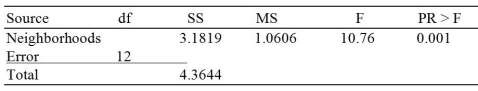
-Referring to Table 10-17, the within group mean squares is ________.
A) 0.0985
B) 0.2910
C) 1.0606
D) 1.1825
Correct Answer:
Verified
Q227: TABLE 10-17
A realtor wants to compare the
Q228: TABLE 10-18
As part of an evaluation program,
Q229: TABLE 10-18
As part of an evaluation program,
Q230: TABLE 10-17
A realtor wants to compare the
Q231: TABLE 10-17
A realtor wants to compare the
Q233: TABLE 10-18
As part of an evaluation program,
Q234: TABLE 10-18
As part of an evaluation program,
Q235: TABLE 10-17
A realtor wants to compare the
Q236: TABLE 10-18
As part of an evaluation program,
Q237: TABLE 10-18
As part of an evaluation program,
Unlock this Answer For Free Now!
View this answer and more for free by performing one of the following actions

Scan the QR code to install the App and get 2 free unlocks

Unlock quizzes for free by uploading documents