TABLE 13-8
A financial analyst wanted to examine the relationship between salary (in $1,000) and four variables: age (X1 = Age), experience in the field (X2 = Exper), number of degrees (X3 = Degrees), and number of previous jobs in the field (X4 = Prevjobs). He took a sample of 20 employees and obtained the following Microsoft Excel output:
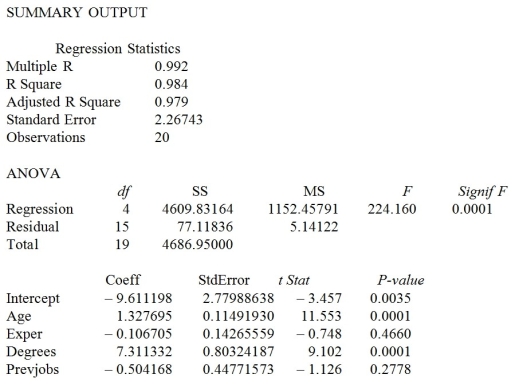
-Referring to Table 13-8, the analyst wants to use a t test to test for the significance of the coefficient of X₃. The value of the test statistic is ________.
Correct Answer:
Verified
Q107: TABLE 13-8
A financial analyst wanted to examine
Q108: TABLE 13-7
The department head of the accounting
Q109: TABLE 13-8
A financial analyst wanted to examine
Q110: TABLE 13-7
The department head of the accounting
Q111: TABLE 13-8
A financial analyst wanted to examine
Q113: TABLE 13-8
A financial analyst wanted to examine
Q114: TABLE 13-7
The department head of the accounting
Q115: TABLE 13-7
The department head of the accounting
Q116: TABLE 13-7
The department head of the accounting
Q117: TABLE 13-8
A financial analyst wanted to examine
Unlock this Answer For Free Now!
View this answer and more for free by performing one of the following actions

Scan the QR code to install the App and get 2 free unlocks

Unlock quizzes for free by uploading documents