The graph below represents a wave function (x) for a particle confined to -4.00 m x +4.00 m.The magnitude of the normalisation constant A is: 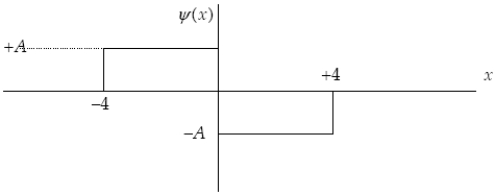
A) 
B) 
C) 
D) 
E) 4.
Correct Answer:
Verified
Q24: The wave function
Q25: Frank says that quantum mechanics does not
Q26: A particle in a finite potential
Q27: An electron has been accelerated by
Q28: Assume we can determine the position of
Q30: Because the factor h on the
Q31: Find the uncertainty in the momentum (in
Q32: The wave function for a particle in
Q33: Assume the Heisenberg uncertainty principle can
Q34: A particle in a finite potential
Unlock this Answer For Free Now!
View this answer and more for free by performing one of the following actions

Scan the QR code to install the App and get 2 free unlocks

Unlock quizzes for free by uploading documents