Graph 18-1 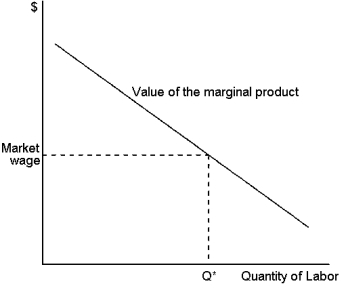 This graph represents the value of marginal product for a firm that sells its product in a competitive market.Use the graph to answer the following question(s) .
-Refer to Graph 18-1.The value of the marginal product curve shown here is equivalent to which of the following?
A) the demand curve for labour
B) the supply curve for labour
C) the labour production function
D) the total revenue curve
Correct Answer:
Verified
Q167: Graph 18-2 Q168: Graph 18-2 Q169: Graph 18-2 Q170: Graph 18-2 Q171: Graph 18-1 Q173: Table 18-2 Q174: Table 18-1 Q175: Table 18-2 Q176: Table 18-1 Q177: Table 18-1 Unlock this Answer For Free Now! View this answer and more for free by performing one of the following actions Scan the QR code to install the App and get 2 free unlocks Unlock quizzes for free by uploading documents![]()
![]()
![]()
![]()
![]()
The production details of a
The production details of a

