Multiple Choice
Graph 18-1 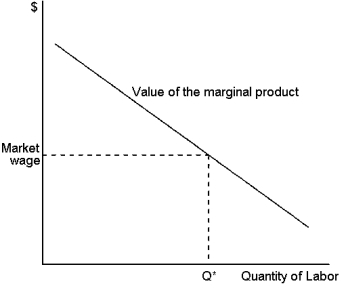 This graph represents the value of marginal product for a firm that sells its product in a competitive market.Use the graph to answer the following question(s) .
-Refer to Graph 18-1.The shape of the curve suggests the presence of:
A) increasing returns to scale
B) increased productivity with increased labour
C) decreased productivity with decreased labour
D) diminishing marginal product
Correct Answer:
Verified
Related Questions

