Graph 14-5 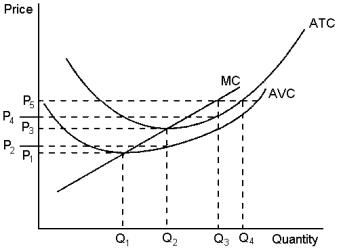 The graph depicts the cost structure of a firm in a competitive market.Use the graph to answer the following question(s) .
-Refer to Graph 14-5.When market price is P5, a profit-maximising firm's profits can be represented by the area:
A) (P5 - P₄) * Q₃
B) P5 * Q₃
C) (P5 - P₃) * Q₂
D) when market price is P5 there are no profits
Correct Answer:
Verified
Q106: Profit-maximising firms enter a competitive market when:
A)total
Q107: A profit-maximising firm that is showing losses
Q108: A production cost that has already been
Q109: Which of the following statements best reflects
Q110: Prawns Galore, a prawn harvesting business in
Q112: If all firms in a market are
Q113: Suppose a profit-maximising firm in a competitive
Q114: In the long run, all of a
Q115: Choose the correct statement.In the long-run, each
Q116: Graph 14-6 ![]()
Unlock this Answer For Free Now!
View this answer and more for free by performing one of the following actions

Scan the QR code to install the App and get 2 free unlocks

Unlock quizzes for free by uploading documents