Graph 14-5 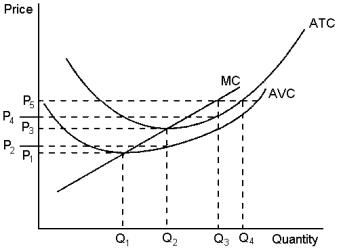 The graph depicts the cost structure of a firm in a competitive market.Use the graph to answer the following question(s) .
-Refer to Graph 14-5.When market price is P₂, a profit-maximising firm's losses can be represented by the area:
A) (P₃ - P₂) * Q₂
B) (P₂ - P₁) * Q₂
C) at a market price of P₂, the firm does not have losses
D) at a market price of P₂, the firm has losses, but the reference points in the graph don't identify the losses
Correct Answer:
Verified
Q113: Suppose a profit-maximising firm in a competitive
Q114: In the long run, all of a
Q115: Choose the correct statement.In the long-run, each
Q116: Graph 14-6 Q117: A profit-maximising firm in a competitive market Q119: The Wheeler Wheat Farm has a long-term Q120: When profit-maximising firms in competitive markets are Q121: Suppose a movie theatre stays open late Q122: For any given price, a firm in Q123: Which of the following statements are most![]()
Unlock this Answer For Free Now!
View this answer and more for free by performing one of the following actions

Scan the QR code to install the App and get 2 free unlocks

Unlock quizzes for free by uploading documents