Graph 13-2 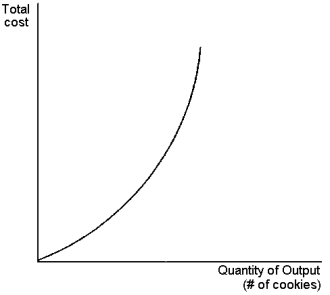 This graph depicts a total cost function for a firm that produces cookies.Use the graph to answer the following question(s) .
-Refer to Graph 13-2.Which of the statements below best captures information about the underlying production function?
A) output increases at a decreasing rate with additional units of input
B) output increases at an increasing rate with additional units of input
C) output decreases at a decreasing rate with additional units of input
D) output decreases at an increasing rate with additional units of input
Correct Answer:
Verified
Q80: If a business is profitable from an
Q81: Graph 13-2 Q82: Average total cost is: Q83: Jeremy, a small business owner, earns $50 Q84: A firm's variable costs divided by the![]()
A)the cost to produce
Unlock this Answer For Free Now!
View this answer and more for free by performing one of the following actions

Scan the QR code to install the App and get 2 free unlocks

Unlock quizzes for free by uploading documents