Multiple Choice
Graph 10-2 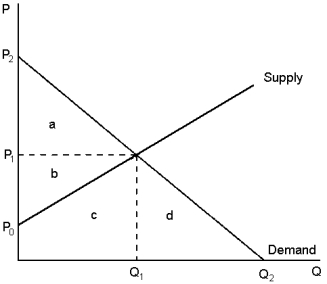 This graph depicts the market for pork.Use this information to answer the following question(s) .
-In Graph 10-2, producer and consumer surplus at the point of market efficiency is represented by area(s) :
A) a + b
B) a + d
C) b + c
D) c + d
Correct Answer:
Verified
Related Questions
Q58: When Jake takes into account how his
Q59: A positive externality exists when:
A)a person engages
Q60: Brent and Jess live together.Every morning, Jess
Q61: Graph 10-2 Q62: A ???_ is enacted to correct the![]()
Unlock this Answer For Free Now!
View this answer and more for free by performing one of the following actions

Scan the QR code to install the App and get 2 free unlocks

Unlock quizzes for free by uploading documents