Graph 10-3 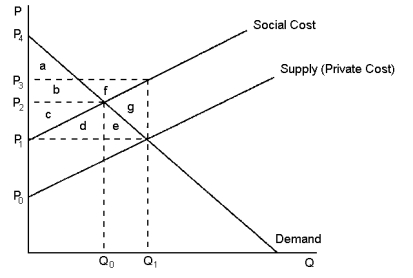 This graph reflects the market for kiwifruit, where pesticide used by kiwifruit orchardists also unintentionally kills honey bees.
-Refer to Graph 10-3.The social cost curve is above the supply curve because:
A) it takes into account the external costs imposed on society by the kiwifruit farmers
B) honeybees are also a cost to society
C) kiwifruits are likely to cost more than growing the kiwifruit costs the organisers
D) workers on kiwifruit orchards also benefit from the job opportunities
Correct Answer:
Verified
Q85: Which of the following statements about internalising
Q86: When a market is in equilibrium and
Q87: Technology spillover occurs when:
A)the firm's innovations allow
Q88: Graph 10-3 Q89: Graph 10-3 Q91: Suppose that a steel factory emits a Q92: Internalising a positive production externality will cause Q93: Which of the following statements is most Q94: When a producer operates in a market Q95: Graph 10-3 Unlock this Answer For Free Now! View this answer and more for free by performing one of the following actions Scan the QR code to install the App and get 2 free unlocks Unlock quizzes for free by uploading documents![]()
![]()
![]()

