Graph 10-3 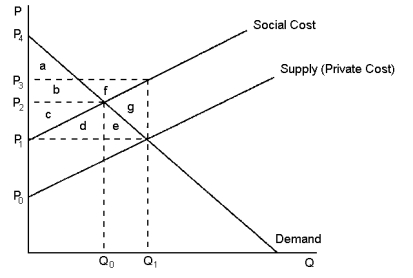 This graph reflects the market for kiwifruit, where pesticide used by kiwifruit orchardists also unintentionally kills honey bees.
-Refer to Graph 10-3.What price and quantity combination best represents the optimum price and number of kiwifruit trays that should be produced?
A) P₁, Q₁
B) P₂, q₀
C) P₃, Q₁
D) The optimum quantity is zero kiwifruit as long as honey production by beekeepers is lower because of pesticide use.
Correct Answer:
Verified
Q93: Which of the following statements is most
Q94: When a producer operates in a market
Q95: Graph 10-3 Q96: Suppose fertiliser use on pastoral land causes Q97: Melbourne city council is trying to quantify Q99: Markets are inefficient when positive production externalities![]()
Unlock this Answer For Free Now!
View this answer and more for free by performing one of the following actions

Scan the QR code to install the App and get 2 free unlocks

Unlock quizzes for free by uploading documents