Graph 10-5 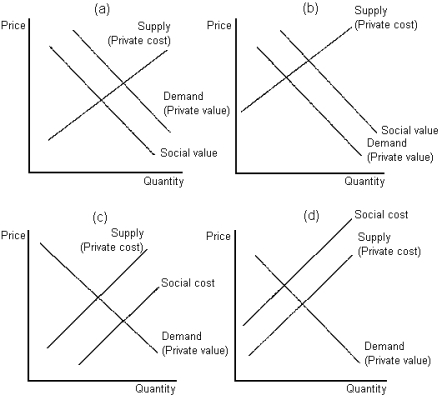
-Refer to Graph 10-5.Which of the graphs shown best depicts the case of a negative production externality?
A) panel (a)
B) panel (b)
C) panel (c)
D) panel (d)
Correct Answer:
Verified
Q169: In which of the following situations may
Q170: A broad-based carbon tax may be preferred
Q171: Some environmentalists argue that we should protect
Q172: In France, drivers in one central region
Q173: Graph 10-5 Q175: Tim and Tom are having an argument Q176: Which of the following are characteristics of Q177: Pigovian taxes are unlike most other taxes Q178: When one firm sells its pollution permit Q179: Graph 10-5 ![]()
![]()
Unlock this Answer For Free Now!
View this answer and more for free by performing one of the following actions

Scan the QR code to install the App and get 2 free unlocks

Unlock quizzes for free by uploading documents